Download PDF
This annex provides both an assessment of the human and financial costs of the wars in Afghanistan and Iraq and a baseline for assessing broader strategic gains and losses from a decade-plus of war. It reviews official U.S. Government data and private studies that attempt to capture the direct costs of U.S. operations in Afghanistan and Iraq, as well as some of the related and projected costs associated with the operations such as healthcare and disability costs for veterans and interest on the debt. While the annex focuses specifically on U.S. costs, it also briefly reviews costs incurred by our allies, host-nation security forces, and local populations.
Many organizations, both public and private, have developed cost assessments for the wars. Some document the expense solely in terms of casualties and funds, while others attempt to include indirect costs such as environmental impact and macroeconomic costs. Individual governmental agencies (Department of Defense [DOD], Department of Labor, and Department of Veterans Affairs) have at various times issued numbers on the human and financial costs of the wars, but there has been no official publically available systematic report on war costs by these agencies. The Congressional Research Service (CRS), Congressional Budget Office (CBO), and Government Accountability Office (GAO) have published over 50 reports detailing the human and financial tolls. CRS has been relying on nonpublic DOD reports of war costs issued to the four congressional defense committees, as well as CRS, CBO, and GAO. In addition, Congress created the Office of the Special Inspector General for Iraq Reconstruction (SIGIR) and Special Inspector General for Afghanistan Reconstruction (SIGAR) to document fraud, waste, and abuse.1
Academics and think tanks have also put forth considerable effort to document and assess the cost of both wars. The Center for Strategic and International Studies and Center for Strategic and Budgetary Assessments have produced several studies that document the costs of the wars.2 The Watson Institute of International Affairs at Brown University hosts the Cost of War Project, which consists of more than 30 economists, anthropologists, lawyers, humanitarian personnel, and political scientists working to compile and conduct the first comprehensive analysis of these wars in terms of human casualties and economic costs.3 Researchers in the John F. Kennedy School of Government at Harvard University have published extensively on the financial legacy of Iraq and Afghanistan, specifically highlighting how wartime spending decisions will impact future national security budgets.4 Other organizations, such as the Iraq Body Count, look specifically at the civilians harmed or displaced by violence and how the wars have spilled into neighboring states.5
Given the number of estimates that exist, and the fact that each organization reaches its conclusions operating under varied assumptions and using different projection calculations, it is challenging to come up with a single definitive figure for the costs of the two wars. For the most part this annex relies on numbers provided from official government sources. However, where gaps exist in official data, this annex relies on figures and conclusions reached by some of the academic studies listed herein. Finally, in reality, determining an accurate ultimate cost sheet for the wars is an impossible endeavor at this point as the war in Afghanistan is ongoing, while U.S. efforts in Iraq against the Islamic State of Iraq and the Levant (Operation Inherent Resolve) were funded at $5 billion in the December 2014 Consolidated and Further Continuing Appropriation Act, 2015, with a further $8.8 billion requested for fiscal year (FY) 2016.6
Cost in Human Life
The number of U.S. Servicemember casualties of the campaigns in Iraq and Afghanistan pales in comparison to other wars such as World War I and World War II, nor does the toll from these campaigns come close to the cost in lives associated with the wars in Vietnam and Korea. Undoubtedly, the reduction in casualty numbers and high survival rates for seriously wounded troops can be attributed to the incredible advancements in the field of medicine, armored vehicles, body armor, and the asymmetric nature of the conflicts. However, it does not lessen the burden for those who lost loved ones or those whose lives are altered due to limb amputations, traumatic brain injuries (TBI), chronic severe depression, and/or post-traumatic stress disorder (PTSD). Moreover, American soldiers were not alone in making the ultimate sacrifice; U.S. civilian government personnel also gave their lives.7
Also shouldering the burden with U.S. soldiers and government employees were U.S. citizens, third-country nationals, and local nationals who served as contractors to U.S. Government agencies.8 Finally, the cost of war must also take into account the number of lives that were lost on September 11, 2001. After all, it was the events of that day and the subsequent loss of 2,977 lives in New York City, Washington, DC, and Shanksville, Pennsylvania, that triggered the ensuing decade of war and its aftermath.
DOD Personnel
According to its own casualty report, DOD deaths (both military and civilian) reported for Operation Enduring Freedom (OEF), Operation Iraqi Freedom (OIF), and their follow-on operations total 6,855 lives (see table 1 for a historical comparison).9 In August 2014, the United States lost its highest-ranking Soldier with the death of Major General Harold J. Greene, USA. He was the first American general killed in a combat zone since Vietnam.
Table 1. Overall Department of Defense Casualties (as of June 4, 2015)
|
Conflict
|
Servicemember Deaths
|
DOD Civilian Deaths
|
Servicemember Wounded in Action
|
|
World War Ia
|
116,516
|
|
204,002
|
|
World War II
|
405,399
|
|
670,846
|
|
Korean War
|
36,574
|
|
103,284
|
|
Vietnam
|
58,220
|
|
303,644
|
|
|
|
Operation Iraqi Freedomb, c
|
4,411
|
13
|
31,951
|
|
Operation New Dawnd
|
66
|
0
|
295
|
|
Operation Inherent Resolvee
|
6
|
0
|
1
|
|
Operation
Enduring Freedomf
|
2,351
|
4
|
20,069
|
|
Operation
Freedom’s Sentinelg
|
2
|
1
|
24
|
|
Total, 2001–2014
|
6,836
|
18
|
52,340
|
a. Defense Casualty Analysis System, “Principal Wars in Which the United States Participated—U.S. Military Personnel Serving and Casualties (1775–1991),” available at at <www.dmdc.osd.mil/dcas/pages/report_principal_wars.xhtml>.
b. Department of Defense, Casualty Status, Fatalities as of June 15, 2015, 10 a.m. EDT, available at <www.defense.gov/news/casualty.pdf>.
c. Operation Iraqi Freedom includes casualties that occurred between March 19, 2003, and August 31, 2010, in the Arabian Sea, Bahrain, Gulf of Aden, Gulf of Oman, Iraq, Kuwait, Oman, Persian Gulf, Qatar, Red Sea, Saudi Arabia, and the United Arab Emirates. Prior to March 19, 2003, casualties in these countries were considered under Operation Enduring Freedom. Personnel injured in Iraqi Freedom who die after September 1, 2010, will be included in statistics from that operation.
d. Operation New Dawn includes casualties that occurred between September 1, 2010, and December 31, 2011, in the Arabian Sea, Bahrain, Gulf of Aden, Gulf of Oman, Iraq, Kuwait, Oman, Persian Gulf, Qatar, Red Sea, Saudi Arabia, and the United Arab Emirates. Personnel injured in New Dawn who die after December 31, 2011, will be included in statistics from that operation.
e. Operation Inherent Resolve includes casualties that occurred in Bahrain, Cyprus, Egypt, Iraq, Israel, Jordan, Kuwait, Lebanon, Qatar, Saudi Arabia, Syria, Turkey, the United Arab Emirates, the Mediterranean Sea east of 25° longitude, the Persian Gulf, and the Red Sea.
f. Operation Enduring Freedom includes casualties that occurred between October 7, 2001, and December 31, 2014, in Afghanistan, Guantanamo Bay (Cuba), Djibouti, Eritrea, Ethiopia, Jordan, Kenya, Kyrgyzstan, Pakistan, the Philippines, Seychelles, Sudan, Tajikistan, Turkey, Uzbekistan, and Yemen.
g. Operation Freedom’s Sentinel includes casualties that occurred in Afghanistan after January 1, 2015.
Figure 1. Traumatic Brain Injury Over Time, 2000–2014 (as of August 19, 2014)
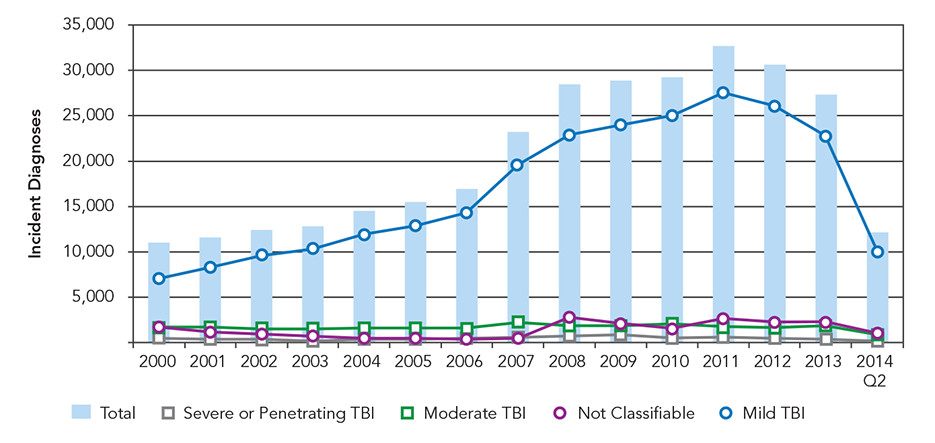
Source: Hannah Fischer, A Guide to U.S. Military Casualty Statistics: Operation Inherent Resolve, Operation New Dawn, Operation Iraqi Freedom, and Operation Enduring Freedom, RS22452 (Washington, DC: Congressional Research Service, November 20, 2014).
Figure 2. Major Limb Amputations Due to Battle Injuries in Operation Iraqi Freedom, Operation New Dawn, and Operation Enduring Freedom, 2001–2014 (as of September 1, 2014)
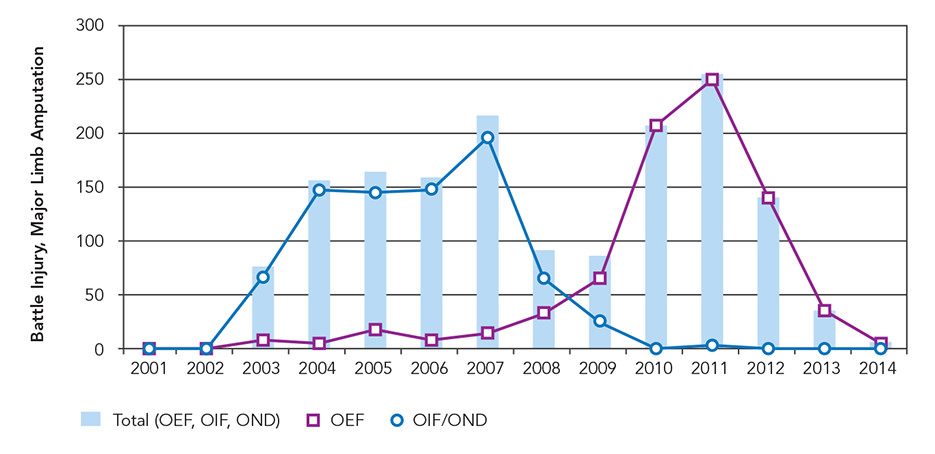
Source: Hannah Fischer, A Guide to U.S. Military Casualty Statistics: Operation Inherent Resolve, Operation New Dawn, Operation Iraqi Freedom, and Operation Enduring Freedom, RS22452 (Washington, DC: Congressional Research Service, November 20, 2014).
Figure 3. Annual Post-Traumatic Stress Disorder Diagnoses in All Services, 2000–2014 (as of September 5, 2014)
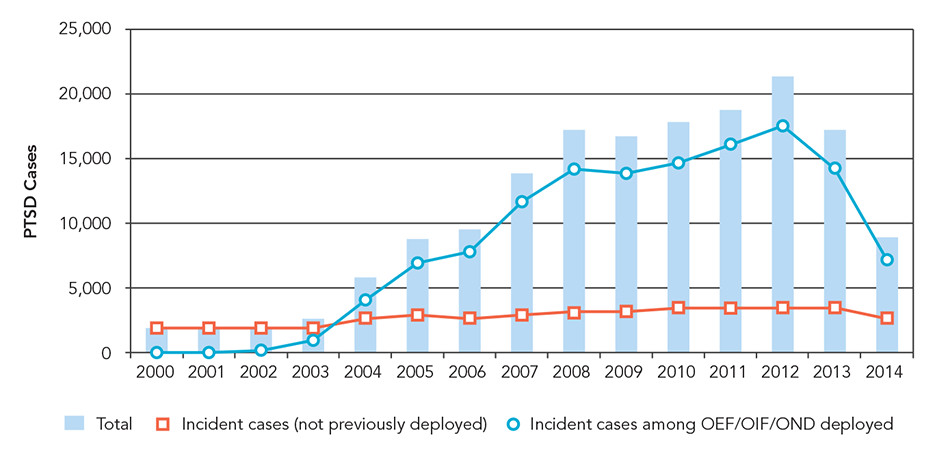
Source: Hannah Fischer, A Guide to U.S. Military Casualty Statistics: Operation Inherent Resolve, Operation New Dawn, Operation Iraqi Freedom, and Operation Enduring Freedom, RS22452 (Washington, DC: Congressional Research Service, November 20, 2014).
Beyond the dead, 52,340 Servicemembers have been physically wounded in the wars. According to the Veterans Health Administration, 1,158,359 veterans of Afghanistan and Iraq have been treated for a wide range of medical issues, the vast majority of them as outpatients.10 That number is likely to grow while operations in both theaters continue. The most frequent diagnoses of veterans have been musculoskeletal ailments, mental disorders, and “Symptoms, Signs and Ill-defined Conditions.”11 The three enduring and most debilitating ailments associated with these operations are traumatic brain injuries, major limb amputations, and PTSD. In terms of TBI, figure 1 documents the increase over the past decade of war. According to the Defense and Veterans Brain Injury Center, in 2000 there were a reported 10,958 cases of TBI. Between 2005 and 2012 (the peak of the war efforts in Iraq and Afghanistan), the average number of cases reported per year was 25,668.12 The vast majority of TBI cases (85.8 percent) between 2000 and 2014 have been classified as “mild,” with 8.6 percent classified as “moderate,” and 2.6 percent as “severe or penetrating.”13
Figure 2 documents major limb amputations due to battle injuries in OEF and OIF between 2001 and September 2014. From 2003 until the first quarter of 2009, the majority of the major limb amputations due to battle injuries occurred in OIF. In the second quarter of 2009, the trend changed and since that time the majority of the major limb amputations due to battle injuries have occurred in OEF. As of September 2014, 1,573 soldiers have lost a limb due to the wars in Afghanistan and Iraq.14 By comparison, in Vietnam, 5,283 soldiers lost a limb.15
Both figures 1 and 2 illustrate a dramatic increase in these injuries at the height of the wars. Figure 3 documents the reported cases of PTSD among Servicemembers who deployed to Iraq and Afghanistan and those who did not. Between 2000 and 2014, there were a reported 36,321 cases of PTSD among Servicemembers who did not deploy. During that same time period, among soldiers who deployed to Afghanistan and/or Iraq, 128,496 cases of PTSD were reported.16
Many observers have voiced concerns that repeated deployments and shorter “dwell” times at home may have increased the mental health toll on Servicemembers, even as ongoing studies grapple with the exact nature of the causal link between the two.17 According to a CRS report, between 2001 and 2011, the rate of mental health diagnoses among Active-duty Servicemembers increased approximately 65 percent.18 Between 2000 and 2011, diagnoses of adjustment disorders, depression, and anxiety disorders (excluding PTSD) made up 26 percent, 17 percent, and 10 percent, respectively, of all diagnoses. Alcohol abuse and dependence disorders and substance abuse and dependence disorders made up 13 percent and 4 percent, respectively. PTSD represented approximately 6 percent of mental disorder diagnoses over this time period.19 According to a 2012 Medical Surveillance Monthly Report, beginning in 2010, suicide has become the second leading cause of death for Active-duty Servicemembers, behind only war injuries.20 Taken together, it is clear that in addition to loss of life there is a significant psychological cost of these wars affecting Servicemembers, veterans, and their families, and it will continue to have an impact for years to come.
U.S. Contractors
Unique to modern U.S. wars are the tremendous contributions of contractors working alongside U.S. military and government personnel. More so than any other wars in U.S. history, civilians worked together with military counterparts in Afghanistan and Iraq, providing a range of services including transportation, construction, base support, intelligence analysis, and private security. According to CRS, over the last decade in Iraq and Afghanistan contractors accounted for 50 percent or more of the total military force.21 When accounting for the contractors hired by other government agencies such as the Department of State and U.S. Agency for International Development (USAID), it is fair to say that there have been more contractors on the ground in these countries than U.S. troops—even at the peak of these operations. And in such service, many civilian contactors were killed or injured. According to a report in the New York Times, the contractor with the highest war zone deaths is the defense giant L-3 Communications: “If L-3 were a country, it would have the third highest loss of life in Afghanistan as well as in Iraq; only the United States and Britain would exceed it in fatalities.”22
Unlike the easily accessible and reliable figures documenting the loss in life of American Servicemembers, there is not an equally accurate account of contractor casualties. Under the Federal Defense Base Act, American defense contractors are obligated to report the war zone deaths and injuries of their employees—including subcontractors and foreign workers—to the Department of Labor and to carry insurance that provides employees with medical care and compensation. According to one expert, however, since many contractors do not comply with even the current reporting requirements, the true number of private contractor deaths may be far higher.23 Moreover, while contractors have been killed in large numbers, a full and accurate accounting has not yet been conducted by DOD, Department of State, and USAID (although Congress instructed those agencies to do so).24 Consequently, the numbers in table 2 are at best a sound, conservative estimate based on the Defense Base Act case summary reports through March 2015.
The U.S. Department of Labor’s Office of Workers’ Compensation Programs’ Defense Base Act case summaries indicate that 1,592 contractors lost their lives in Afghanistan, and 1,620 in Iraq (see table 2). In terms of contractors injured in action, which the Department of Labor categorizes as “lost time 4 days or more,” 13,813 were injured in Afghanistan and 18,309 in Iraq.25 Other initiatives to collect data on contractor casualties find that these numbers are conservative. Efforts to better capture contractor casualties are ongoing. At the high end of the spectrum, the Cost of War Project estimates that 3,401 contractors died in Afghanistan and 3,481 in Iraq.26 More in line with the Department of Labor numbers, an online blog called the Defense Base Act Compensation Blog cites 3,187 contractor deaths in Iraq and Afghanistan.27 However, the blog cites a much higher injured figure of 86,375.
Table 2. Overall Casualties, 2001–2015
|
Conflict
|
Operation Iraqi Freedom
|
Operation
Enduring Freedom
|
Totals 2001–2015
|
|
Servicemembersa
|
4,483
|
2,353
|
6,837
|
|
DOD Civiliansa
|
13
|
5
|
18
|
|
U.S. Government Civilians (non-DOD)b
|
6–12
|
10–15
|
16–27
|
|
Allied Troopsc
|
319
|
1,130
|
1,449
|
|
Local Security Forcesd
|
12,000
|
13,729–23,470
|
25,729–35,470
|
|
U.S.
Contractorse
|
1,620
|
1,592
|
3,212
|
|
Host-
Nation Civiliansf
|
137,000–165,000
|
21,415–26,000
|
158,415–191,000
|
|
Journalistsg
|
221
|
25
|
246
|
|
NGO
Workersg
|
62
|
331
|
393
|
a. Figures as of June 15, 2015, 10 a.m. EDT. See Department of Defense, Casualty Status, available at <www.defense.gov/news/casualty.pdf>. Operation Iraqi Freedom includes casualties that occurred between March 19, 2003, and August 31, 2010, in the Arabian Sea, Bahrain, Gulf of Aden, Gulf of Oman, Iraq, Kuwait, Oman, Persian Gulf, Qatar, Red Sea, Saudi Arabia, and the United Arab Emirates. Prior to March 19, 2003, casualties in these countries were considered under Operation Enduring Freedom. Personnel injured in Iraqi Freedom who die after September 1, 2010, will be included in statistics from that operation. Also included for Iraq are Operation New Dawn (casualties that occurred between September 1, 2010, and December 31, 2011, in the Arabian Sea, Bahrain, Gulf of Aden, Gulf of Oman, Iraq, Kuwait, Oman, Persian Gulf, Qatar, Red Sea, Saudi Arabia, and United Arab Emirates) and Operation Inherent Resolve (casualties that occurred in Bahrain, Cyprus, Egypt, Iraq, Israel, Jordan, Kuwait, Lebanon, Qatar, Saudi Arabia, Syria, Turkey, the United Arab Emirates, the Mediterranean Sea east of 25° longitude, the Persian Gulf, and the Red Sea). Enduring Freedom includes casualties that occurred between October 7, 2001, and December 31, 2014, in Afghanistan, Guantanamo Bay (Cuba), Djibouti, Eritrea, Ethiopia, Jordan, Kenya, Kyrgyzstan, Pakistan, the Philippines, Seychelles, Sudan, Tajikistan, Turkey, Uzbekistan, and Yemen. Also included for Afghanistan is Operation Freedom’s Sentinel (includes casualties that occurred in Afghanistan after January 1, 2015).
b. No central data point for U.S. Government (USG) civilian fatalities was identified. Numbers are derived from Department of State, Bureau of Diplomatic Security, Significant Attacks Against U.S. Diplomatic Facilities and Personnel: 1998–2013 (Washington, DC: Department of State, May 2014), available at <www.state.gov/documents/organization/225846.pdf>. Ranges reflect ambiguities in reporting “U.S. citizen” versus “USG employee” deaths.
c. Figures as of June 11, 2015, available at <www.icasualities.org>.
d. There are multiple sources with considerable variation in data due to uncertain reporting. See “Afghanistan Index,” The Brookings Institution, Washington, DC, available at <www.brookings.edu/about/programs/foreign-policy/afghanistan-index>; “Human Costs of War: Direct War Death in Afghanistan, Iraq, and Pakistan, October 2001–April 2015,” Costs of War, available at <www.costsofwar.org/sites/default/files/%28Home%20page%20figures%29%20SUMMARY%20-%20Direct%20War%20Death%20Toll.pdf>; “Iraq Index,” The Brookings Institution, Washington, DC, available at <www.brookings.edu/about/centers/middle-east-policy/iraq-index>.
e. Department of Labor, “Defense Base Act Case Summary by Nation,” accessed March 31, 2015, available at <www.dol.gov/owcp/dlhwc/dbaallnation.htm>.
f. Iraq Body Count (IBC) records violent civilian deaths that have resulted from the 2003 military intervention in Iraq. Its public database includes deaths caused by U.S.-led coalition forces and paramilitary or criminal attacks by others. IBC is available at <www.iraqbodycount.org/about/>; “Human Costs of War”; United Nations Assistance Mission in Afghanistan, Reports on the Protection of Civilians, available at <http://unama.unmissions.org/Default.aspx?tabid=13941&language=en-US>.
g. Figures from “Human Costs of War: Direct War Death in Afghanistan, Iraq, and Pakistan, October 2001–April 2015.”
Only a small proportion of contractors working on U.S. Government contracts are U.S. citizens. In FY 2010, 24 percent of all contractors in Afghanistan and Iraq (including those working for DOD, State, and USAID) were U.S. nationals, 44 percent were local Iraqis or Afghans, and 32 percent were from third countries.28 A 2013 CRS report found that roughly 30 percent of DOD contractors in theater were U.S. citizens in Iraq (early 2012) and Afghanistan (early 2013), respectively.29 As a result, the bulk of contractor casualties are non-Americans. The majority have been Afghan and Iraqi nationals working under U.S. Government contracts.30 Nationals from Fiji, Turkey, Nepal, and the Philippines have also died while serving as contractors for the U.S. Government.
While there are numerous studies on the mental impacts of Afghanistan and Iraq on Servicemembers, there is no parallel effort to capture the psychological toll on contractors. According to one report, injured contractors who are U.S. citizens have had a more difficult time getting care than returning Servicemembers. Contractors also lack the support network available to returning troops through Tricare or the Department of Veterans Affairs. Their care depends on getting workers’ compensation payments, and they have often had to struggle with insurance companies to get quality care or even to get medical bills paid.31
Coalition Partners, Host-Nation Civilians, Nongovernmental Workers, and Journalists
In addition to American Servicemember fatalities, international coalition partners recorded 1,449 dead in Afghanistan and Iraq (the largest group was 632 British soldiers killed).32 The groups that shouldered the greatest burden in these wars, however, were the local populations and security forces of Afghanistan and Iraq. As shown in table 2, it is difficult to provide exact numbers for these groups. Because different sources use different time periods and methodologies to arrive at their numbers, the estimates provided here should, to quote a CRS report on the subject, “be viewed as guideposts rather than statements of fact.”33 The ranges provided for local populations and security forces are based on (table 2, notes d, f) and represent conservative estimates from 25,729 to 35,470 security forces and 158,415 to 191,000 civilians killed. Beyond host-nation civilians, casualties were also recorded for nongovernmental (NGO) workers and journalists. According to the Cost of War Project, 393 NGO employees lost their lives in Afghanistan and Iraq, and 246 journalists were killed in both conflicts (table 2, note g).
It is far too early to assess the indirect impact of a decade-plus of war on host-nation civilians. Like soldiers, many suffer the same physical and psychological wounds from limb amputations to severe depression and PTSD. However, they often lack the medical support services to treat and mitigate the debilitating and devastating effects of these enduring injuries and ailments. Moreover, the culture of violence and sectarianism remains ever present and the risk of new conflict is real as the recent advances of ISIL in Iraq have made all too obvious. In fact, the Iraq Body Count notes that 2014 has been the third deadliest year after 2006 and 2007 for Iraqi civilians.34 In Afghanistan, the United Nations Assistance Mission in Afghanistan reported that 2014 saw the highest number of civilian deaths and injuries recorded in a single year since 2009.35
Cost in Dollars
How much does war cost? Experts have been devising elaborate methods to account for not only the direct obligations of war, but also projected costs from the interest on large promissory notes to the expanded long-term medical and healthcare costs required to support veterans. Two of the most prominent scholars in this area are Nobel Laureate economist Joseph Stiglitz and Linda Bilmes.36 Stiglitz and Bilmes examined both the operational direct costs and future costs. They also delved into what they call the macroeconomic costs, such as the impact of higher oil prices on weakening aggregate demand and the link between oil prices and decisions of the Federal Reserve to loosen monetary and regulatory policy prior to the financial crisis.37 Projections that include these macroeconomic considerations into their accounting of financial costs reach total cost estimates of up to $4.4 trillion dollars.38 While these costs are real, they are often not trackable and require numerous assumptions for future projections.39 For the purpose of this project, this section of the annex focuses on the direct obligations made to pay for the wars in Afghanistan and Iraq and provides examples for estimates of related costs for reference. This section does not delve into the costs incurred by coalition partners.
Figure 4. Estimated War Funding by Operation Fiscal Year 2001–2015 Request (in USD billions of Budget Authority)
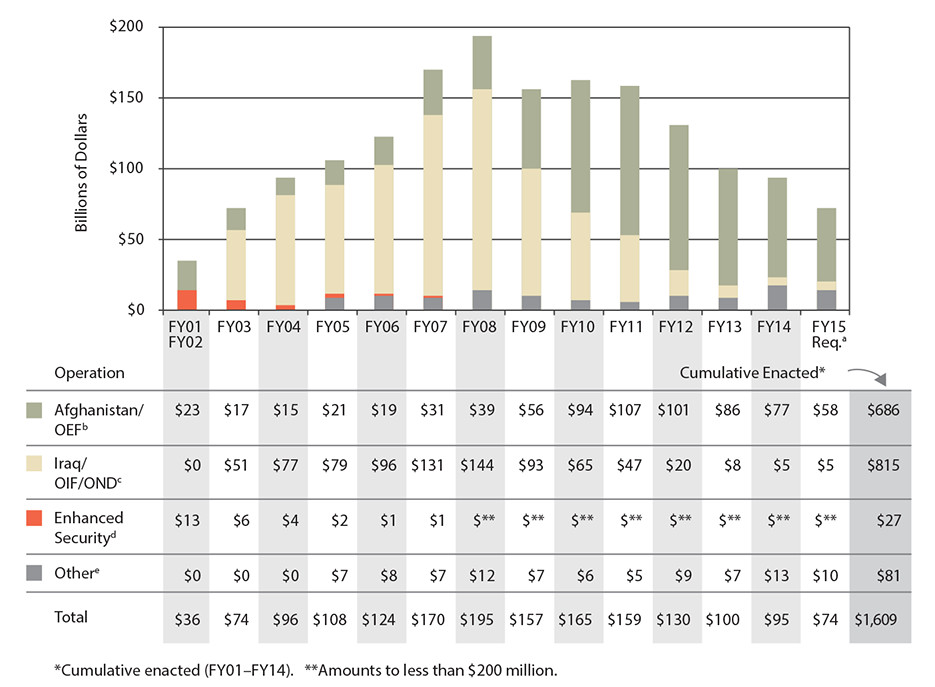
Source: Amy Belasco, The Cost of Iraq, Afghanistan, and Other Global War on Terror Operations Since 9/11, RL33110 (Washington, DC: Congressional Research Service, December 8, 2014).
a. Fiscal year (FY) 2015 reflects June 2014 request (amended) rather than initial placeholder request of $79.4 billion for Department of Defense (DOD); reflects resources not scoring level. Excludes $5.5 billion requested for Operation Iraqi Freedom in FY2015.
b. DOD refers to the Afghan War as Operation Enduring Freedom, primarily military and other operations in Afghanistan as well as in-theater support in neighboring countries and other counterterror operations (for example, the Philippines and Djibouti).
c. DOD referred to the Iraq War as Operation Iraqi Freedom until September 1, 2010, when U.S. forces transitioned from combat operations to advising, assisting, and training Iraqi forces. The mission was renamed Operation New Dawn, which ended December 31, 2011. On that date, all U.S. forces left Iraq; military personnel continuing to provide in-theater support were assigned to Operationf Enduring Freedom. Excludes new Operation Inherent Resolve request.
d. “Enhanced Security” covers cost of 9/11 attacks to DOD and New York City; referred to as Operation Noble Eagle by DOD.
e. “Other” includes DOD funding designated for a war emergency or Overseas Contingency Operation that is not tracked as a war cost, such as congressional additions for childcare centers, barracks improvements, additional C-130 and C-17 aircraft not requested, as well as unanticipated increases in basic housing allowances, fuel costs, modularity, or restructuring of Army brigades. In recent years, “Other” includes transfers by Congress from base budget operation and maintenance expenses to Title IX war funding.
Table 3. Costs of Major U.S. Wars (in 2011 USD billions)
|
World War I
|
$334
|
|
World War II
|
$4,104
|
|
Korea
|
$341
|
|
Vietnam
|
$738
|
|
Persian Gulf War
|
$102
|
|
Iraq, Afghanistan, war on terror
|
$1,529
|
Source: Stephen Dagget, Costs of Major U.S. Wars, RS22926 (Washington, DC: Congressional Research Service, June 29, 2010), 2.
Notes: Figures for World War I through Persian Gulf War in fiscal year (FY) 2011 USD. Figures for Iraq, Afghanistan, and war on terror from figure 4 converted to FY2011 USD.
Direct Overseas Contingency Operations Budget
In budget terms, the U.S. Government now describes the wars as Overseas Contingency Operations (OCO). According to the latest comprehensive CRS report on the costs of Iraq, Afghanistan, and other Long War operations since 9/11, the United States has obligated $1.6 trillion in OCO funds, most directed at DOD and Department of State.40 Figure 4 provides an overview of estimated war funding by operation to date. Notably, operations in Iraq account for the lion’s share of war costs, despite the fact that these figures do not yet include appropriations for Operation Inherent Resolve. Taken together, these costs make the campaigns since 9/11 the second most expensive war in U.S. history, as shown in table 3. Counting only direct OCO appropriations, America’s longest war has already cost twice as much as its second longest engagement, Vietnam. Remarkably, a cost estimate for Vietnam that does account for additional costs (increased troop levels, debt-servicing, veterans’ compensation, and pensions) through the year 2000 arrives at a total of $1.2 trillion.41 This suggests that, even when comparing long-term and related costs for Vietnam only to the direct OCO appropriations since 2001, post-9/11 operations have already cost more and are likely to far outstrip the largest Cold War–era campaign.
Ongoing Commitments and Future Costs
With over 52,000 U.S. Servicemembers wounded, many of them require extensive medical care, which becomes the responsibility of the Department of Veterans Affairs (VA). According to a recent CRS estimate, the United States has spent $22.8 billion between 2001 and 2015 providing medical care to veterans of the Afghanistan and Iraq wars.42 Beyond medical issues, some Servicemembers were injured so severely that they require disability benefits. The VA reported that over 700,000 Iraq and Afghanistan veterans received disability compensation through September 2013 and that the average annualized cost per patient rose from $8,100 to $12,900 between 2000 and 2013.43According to one estimate, the United States has spent $35 billion in disability payments to Iraq and Afghanistan veterans through the VA between 2001 and 2013.44 The CBO puts the figure at $34 billion for 2001–2015.45 While difficult to predict with a high degree of confidence, past experience suggests that these costs will continue for some time, decades after the wars themselves have ended. According to Linda Bilmes’s estimate, the VA is projected to spend another $836.1 billion in medical care and disability benefits through 2053.46 Others have criticized the underlying methodology for vastly exaggerating potential costs.47
A more conservative projection was offered by the Congressional Budget Office, which released a report that projects the costs of veterans care from 2011 through 2020.48 The report cites two scenarios that operate under slightly different assumptions. In the first scenario, CBO assumes a smaller force deployed after 2013, which according to its estimate will result in $40 billion in projected expenditures. In the second scenario, CBO assumes a larger force presence post-2013, which drives its estimate up to $55 billion. Since the publication of this report, the United States has planned to leave 9,800 troops in Afghanistan through 2015, with smaller troop levels planned for 2016 and 2017. Given those numbers, it is more accurate to cite CBO scenario two figures as it accounts for a significant presence past 2013.
The $1.6 trillion cited in figure 4 represents OCO appropriations made from 2001 through fiscal year 2015. During the writing of this annex, $5 billion in OCO funds had been enacted for FY 2015 to fund Operation Inherent Resolve in Iraq, with an additional $8.8 billion requested for FY2016.49
Total Costs
The direct cost, measured by budget authority, of $1.6 trillion is a baseline figure when it comes to calculating the total costs of America’s post-9/11 campaigns. The Cost of War Project puts the total economic cost at $4.4 trillion through FY 2014.50 Bilmes projects a total cost of $4 to $6 trillion stating that this would make Afghanistan and Iraq “the most expensive wars in U.S. history.”51 Yet many methodological issues remain, particularly in the absence of official statistics to serve as a basis for projections. Moreover, the above quoted $4.1 trillion for World War II represent direct appropriations only. A more comprehensive approach along the lines of Bilmes and Stiglitz or the Cost of War Project would increase that figure dramatically. The fact remains that this has been the second most expensive war in the Nation’s history by the most conservative estimates.
Other Costs and Constraints on the Future
There are many other costs associated with the wars. For example, a number of researchers are looking at environmental costs. At this point, research into these costs is preliminary at best, but there are some organizations that are starting to document environmental impacts of the war on water and soil pollution, toxic dust, greenhouse gas and air pollution from military vehicles, and war-related destruction of forests and wetlands.52
Perhaps the most difficult cost to assess is the constraints placed on future national security policymakers. The financial deficits incurred from the wars, combined with a slow economic recovery, could give policymakers pause before electing to engage in similar operations in the future. The Barack Obama administration has exercised great caution in applying military force (especially in terms of limiting American troop presence) in Libya, Mali, Syria, and Iraq. In 2012, the Obama administration announced that it would rebalance its national security priorities toward Asia, signifying a shift away from the war efforts in the Middle East and Southeast Asia. Yet as of 2015, the United States is still engaged in Afghanistan (Operation Freedom’s Sentinel) and reengaged in Iraq (Operation Inherent Resolve) for which a combined $96 billion in OCO funds have been requested for FY 2016 at the time of writing.53 The human toll and financial legacy of the wars in Afghanistan and Iraq will continue to shape how U.S. policymakers respond to future crises, and how the United States will reshape its military force.
Conclusion
Though the question that this annex attempts to answer appears basic in nature, the reality is that it is a problematic endeavor to capture all the direct, related, and projected costs associated with the wars in Afghanistan and Iraq. As such this annex only offers a point of departure based on a conservative review of official data and private studies. Two macro trends are obvious from the historical tables. One the one hand, the survival rates of U.S. Servicemembers in military operations have improved dramatically. On the other hand, those operations have become increasingly expensive. These fundamental realities will impact on future strategies as leaders decide if, when, and how to use military force.
In summation, the United States lost 6,837 Servicemembers, 34 to 45 government civilian employees, and 3,212 contractors in Afghanistan and Iraq. Over 52,000 soldiers and around 30,000 contractors were wounded or injured. Conservative estimates of the death toll among host-nation civilians and security forces range from 180,000 to almost 230,000. In terms of financial costs, the United States has spent at least $1.6 trillion dollars on the wars with estimates on the high end reaching almost three times that number. Operations are ongoing and a more accurate reckoning will have to wait until they are concluded. Nevertheless, these numbers do provide a baseline for assessing broader strategic gains and losses from the wars in Afghanistan and Iraq.
Notes
- See, for example, Special Inspector General for Iraq Reconstruction (SIGIR), comp., Hard Lessons: The Iraq Reconstruction Experience (Washington, DC: U.S. Independent Agencies and Commissions, 2009); SIGIR, Learning from Iraq (Washington, DC: U.S. Government Printing Office, 2013).
- Anthony H. Cordesman, The U.S. Costs of the Afghan War: FY2002–FY2013 (Washington, DC: Center for Strategic and International Studies, 2012); Anthony H. Cordesman, The Cost of the Iraq War: CRS, GAO, CBO, and DoD Estimates (Washington, DC: Center for Strategic and International Studies, 2008); Steven M. Kosiak, Cost of the Wars in Iraq and Afghanistan, and Other Military Operations Through 2008 and Beyond (Washington, DC: Center for Strategic and Budgetary Assessments, 2008); Todd Harrison, Impact of the Wars in Iraq and Afghanistan on the US Military’s Plans, Programs and Budgets (Washington, DC: Center for Strategic and Budgetary Assessments, 2009).
- See Watson Institute for International and Pubic Affairs at Brown University, available at <http://costsofwar.org/>.
- Linda J. Bilmes, The Financial Legacy of Iraq and Afghanistan: How Wartime Spending Decisions Will Constrain Future National Security Budgets, Faculty Research Working Paper Series 13-006 (Cambridge, MA: Harvard Kennedy School, March 2013).
- Iraq Body Count (IBC) records violent civilian deaths that have resulted from the 2003 military intervention in Iraq. Its public database includes deaths caused by U.S.-led coalition forces and paramilitary or criminal attacks by others. IBC is available at <www.iraqbodycount.org/about/>.
- Lead Inspector General for Overseas Contingency Operations, Operation Inherent Resolve: Quarterly Report and Biannual Report to the United States Congress (Washington, DC: U.S. Government Printing Office, December 17, 2014–March 31, 2015), 16–17, available at <https://oig.state.gov/system/files/oir_042915.pdf>.
- No central data point for U.S. Government civilians killed was identified. Numbers here are derived from news reports and verified using the Department of State Diplomatic Security’s “Significant Attacks Against U.S. Diplomatic Facilities and Personnel: 1998–2013,” available at <www.state.gov/documents/organization/225846.pdf>.
- For a breakdown of contractors by origin, see Moshe Schwartz and Jennifer Church, Department of Defense Use of Contractors to Support Military Operations: Background, Analysis, and Issues for Congress, R43074 (Washington, DC: Congressional Research Service [CRS], May 17, 2013), 23–24.
- Department of Defense Casualty Analysis System, “Fatalities as of June 15, 2015, 10 a.m. EST,” accessed at <www.defense.gov/news/casualty.pdf>.
- Department of Veterans Affairs (VA), Analysis of VA Health Care Utilization among Operation Enduring Freedom (OEF), Operation Iraqi Freedom (OIF), and Operation New Dawn (OND) Veterans (Washington, DC: VA, June 2015), 5, available at <www.publichealth.va.gov/docs/epidemiology/healthcare-utilization-report-fy2015-qtr1.pdf>.
- Ibid., 8. The phrase describes a catch-all category commonly used to diagnose outpatient populations.
- Defense and Veterans Brain Injury Center, “DoD Worldwide Numbers for TBI [Traumatic Brain Injury],” available at <www.dvbic.org/dod-worldwide-numbers-tbi>.
- See Hannah Fischer, A Guide to U.S. Military Casualty Statistics: Operation Inherent Resolve, Operation New Dawn, Operation Iraqi Freedom, and Operation Enduring Freedom, RS22452 (Washington, DC: CRS, November 20, 2014).
- Ibid.
- Ann Leland and Mari-Jana “M-J” Oboroceanu, American War and Military Operations Casualties: Lists and Statistics, RL32492 (Washington, DC: CRS, February 26, 2010), 9.
- Fischer.
- Katherine Blakeley and Don J. Jansen, Post-Traumatic Stress Disorder and Other Mental Health Problems in the Military: Oversight Issues for Congress, R43175 (Washington, DC: CRS, August 8, 2013), 53–57.
- Ibid.
- “Mental Disorders and Mental Health Problems, Active Component, U.S. Armed Forces, 2000–2011,” Medical Surveillance Monthly Report 19, no. 6 (June 2012), 11–17.
- “Deaths by Suicide While on Active Duty, Active and Reserve Components, U.S. Armed Forces, 1998–2011,” Medical Surveillance Monthly Report 19, no. 6 (June 2012), 7–10.
- Schwartz and Church.
- Rod Norland, “Risks of Afghan War Shift from Soldiers to Contractors,” New York Times, February 11, 2012.
- Steven L. Schooner and Collin D. Swan, “Dead Contractors: The Un-Examined Effect of Surrogates on the Public’s Casualty Sensitivity,” Journal of National Security Law & Policy (April 16, 2012).
- Government Accountability Office (GAO), Iraq and Afghanistan: DOD, State, and USAID Face Continued Challenges in Tracking Contracts, Assistance Instruments, and Associated Personnel, GAO-11-1 (Washington, DC: GAO, October 2010), 41; see also Steven L. Schooner, “Why Contractor Fatalities Matter,” Parameters 38 (2008), 78.
- Department of Labor, “Defense Base Act Case Summary by Nation,” accessed March 31, 2015, available at <www.dol.gov/owcp/dlhwc/dbaallnation.htm>.
- “Human Costs of War: Direct War Death in Afghanistan, Iraq, and Pakistan, October 2001–April 2015,” Costs of War, n.d..
- “Civilian Contractor Casualty Count,” Defense Base Act Compensation Blog, accessed August 18, 2014, available at <https://defensebaseactcomp.wordpress.com/civilian-contractor-casualty-count/>.
- Schooner and Swan.
- Schwartz and Church, 24–25.
- T. Christian Miller, “Foreign Workers for the U.S. Are Casualties Twice Over,” ProPublica.org, June 19, 2009.
- T. Christian Miller, “Contractors in Iraq are Hidden Casualties of War,” Los Angeles Times, October 6, 2009.
- See “Iraq Coalition Military Fatalities by Year” and “Afghanistan Coalition Military Fatalities by Year,” accessed at <http://icasualties.org/>.
- Hannah Fischer, Iraq Casualties: U.S. Military Forces and Iraqi Civilians, Police, and Security Forces, R40824 (Washington, DC: CRS, December 6, 2011), summary.
- “Iraq 2014: Civilian Deaths Almost Doubling Year on Year,” available at <https://www.iraqbodycount.org/analysis/numbers/2014/>.
- United Nations Assistance Mission in Afghanistan, “Civilian Casualties in Afghanistan Rise by 22 Percent in 2014,” February 18, 2015.
- On calculating the costs of war, see Joseph Stiglitz and Linda J. Bilmes, “Estimating the Costs of War: Methodological Issues, with Applications to Iraq and Afghanistan,” in Oxford Handbook of the Economics of Peace and Conflict, ed. Michelle Garfinkel and Stergis Skaperdas (Oxford: Oxford University Press, 2012). On the long-term costs, see Joseph Stiglitz and Linda J. Bilmes, The Three Trillion Dollar War: The True Cost of the Iraq Conflict (New York: Norton, 2008); Linda J. Bilmes and Joseph Stiglitz, “The Long-Term Costs of Conflict: The Case of the Iraq War,” in The Handbook on the Economics of Conflict, ed. Derek L. Braddon and Keith Hartley (Northampton, MA: Edward Elgar Publishing, 2011).
- Neta C. Crawford, “U.S. Costs of Wars Through 2014: $4.4 Trillion and Counting,” Costs of War, June 25, 2014.
- Ibid.
- For a discussion of differences in methodologies, see Amy Belasco, The Cost of Iraq, Afghanistan, and Other Global War on Terror Operations Since 9/11, RL33110 (Washington, DC: CRS, December 8, 2014), 3, including footnotes.
- Ibid., summary. The Congressional Budget Office (CBO) estimates a slightly higher total of $1.649 trillion in The Budget and Economic Outlook: 2015 to 2025 (Washington, DC: CBO, January 26, 2015), 81.
- Richard M. Miller, Jr., Funding Extended Conflicts: Korea, Vietnam, and the War on Terror (Santa Monica, CA: Praeger Security International, 2007), 42–67.
- Ibid., 19.
- CBO, Veterans’ Disability Compensation: Trends and Policy Options (Washington, DC: CBO, August 2014), 11–12.
- Bilmes, 6–7.
- CBO, The Budget and Economic Outlook: 2015 to 2025 (Washington, DC: CBO, January 2015), 81.
- Bilmes, 6–7.
- CBO, “The Cost of War: A Comment on Stiglitz-Bilmes,” April 8, 2008, available at <https://www.cbo.gov/publication/24762>.
- Heidi L.W. Golding, Potential Costs of Health Care for Veterans of Recent and Ongoing U.S. Military Operations (Washington, DC: CBO, June 27, 2011).
- Lead Inspector General for Overseas Contingency Operations.
- See “Economic Costs,” Costs of War, April 2015, available at <http://costsofwar.org/article/economic-cost-summary>.
- Bilmes, 1.
- See “Environmental Costs,” Costs of War, April 2015, available at <http://watson.brown.edu/costsofwar/costs/social/environment>.
- Amy Belasco, Defense Spending and the Budget Control Act Limits, R44039 (Washington, DC: CRS, May 19, 2015), 11.